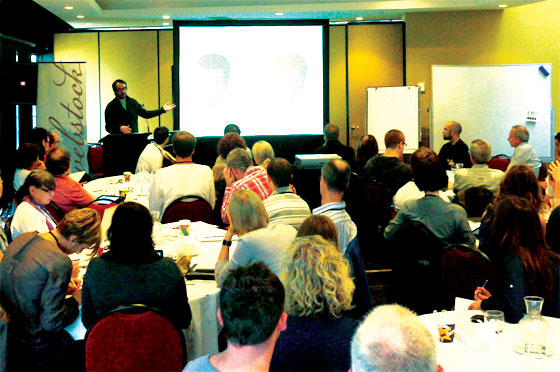
PHOTO SNAFFLED FROM FLICKR: WEBSTOCK (USED UNDER CREATIVE COMMONS)
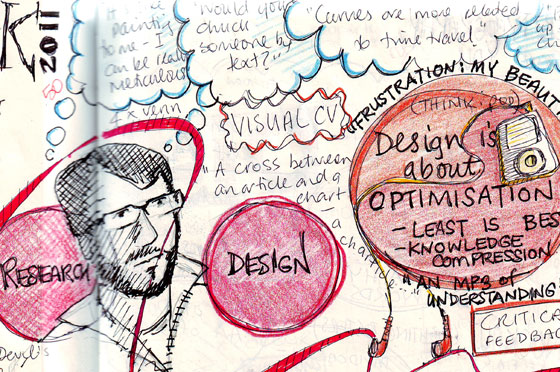
Information is beautiful: David McCandless
"Love pies, hate pie charts."
Full Day workshop: Information is Beautiful with David McCandless was sold out. My poor counting skills put the attendance at about 50 souls.
Info-graphics is the new photo journalism. Because numbers and some concepts are hard to 'get' by designing visual information we bring into focus the connections we didn't see before and discover things that were not initially obvious.
To make this work though, info-graphics need to be self-sufficient - not requiring any other information or complex explanation. They need to be visually optimised - least is best - an "MP# of understanding". The information is revealed through the design and new relationships are discovered between data. It is the best of information married with the best of design. Use these superpowers to tell a story; design a journey; find structure in the data.
Getting down to business
This was a very hands-on workshop. We had two tasks to do - one in the morning, one after lunch.
The first task was to break into groups of three and list 10 concepts that might make an interesting info-graphic. It was amazing, that once we started, the floodgates opened. Such a valuable exercise for realising that these ideas and concepts are all around us - just need to spend a bit of time thinking! We had an hour to create our group list, with David coming to each group and hearing a few ideas from each of us. Very obviously, his mind wears this groove very well as his suggestions and advice gave a glimpse of how agile his mind is. Nothing so obvious as a full frontal attack from Mr McCandless.
Before lunch we each pitched our concept to the entire group. So fantastic to hear all the ideas - even when they were similar they were different - different aspects of the data relationship - and all very interesting.
After lunch, David took us through some of his design work to get our minds ready for the next phase - designing an info-graphic.
Because of the compressed nature of our workshop, there was an assumption that the research had already been done, and the data gathered for the concept we'd chosen. Now it was all about sketching ideas for the info-graphic.
Our group had chosen to explain the recent conflict in Egypt. The info-graphic was to be a timeline - I sketched a timeline with pyramids and palm trees - I mean: why wouldn't you? Our team ended up with a more traditional-looking timeline. The object of the exercise wasn't to end up with an info-graphic, but to see how sketching can bring ideas and concepts together, and then lead eventually to the most interestingly visual way to show the data.
What'd you learn?
I learned that I forgot how exhausting and brilliant a really vibrant, well run workshop can be. This was a day very well spent! Seeing the bones of a process from idea to infographic suits a system thinking type like me. I also sniffed how very difficult this is to do very well. Which you can kinda see in the graphics that hit the nail on the head but still, even more difficult than I supposed.
I also had my first taste of the themes that run through the whole Webstock conference - unorchestrated, I suggest. But David started us off - tell stories, be clear, have integrity. Be beautiful.